Bars typically realize 70-85% gross profit margins on cocktails, positioning mixed drinks as some of the most lucrative offerings on any menu. For instance, a cocktail costing $2.50 to produce and sold at $12 yields a gross profit of $9.50—an impressive margin near 80% that surpasses many other restaurant segments. However, these figures vary substantially depending on ingredient costs, drink complexity, and pricing strategy.

Profitability per drink hinges on multiple factors beyond basic cost and price. While foodservice margins generally hover around 30-40%, well-managed bars sustain 75-80% gross margins on alcoholic beverages, with premium cocktails sometimes reaching 85-90%. Yet, the actual margin depends on the bar’s location, target clientele, inventory management, and operational overhead. These variables underscore the importance of nuanced pricing and cost control to optimize returns.
Other critical influences on bar profitability include ingredient sourcing, overhead expenses such as rent and labor, pricing strategies, happy hour and promotional offers, staff expertise, and seasonality. Understanding these elements and employing data-driven tools like those offered by Evergreen can help bar owners maximize profitability while maintaining quality and customer satisfaction.
Economics of Drink Costs and Overhead in Bars
Ingredient costs critically affect drink pricing and profitability. Variations in alcohol brands, mixers, and garnishes can significantly impact costs. For example, premium spirits increase ingredient expenses but also justify higher menu prices. Bar owners must balance quality and cost to maintain competitive yet profitable pricing. Overhead expenses—including rent, utilities, insurance, and permits—also weigh heavily on margins. Efficient management of these fixed and variable costs is essential to sustaining profitability.
Profit margins differ notably by beverage type due to cost structures, preparation time, and customer expectations. Smart bar operators curate a beverage mix that maximizes overall profitability by balancing high-margin items with volume sellers.
🍸 Premium Cocktails
Typical Margin: 80–90%| Metric | Example | Notes |
|---|---|---|
| Selling Price | $14.00 | Craft cocktail |
| Ingredient Cost | $2.10 | 2 oz bourbon, syrup, bitters, garnish |
| Gross Profit | $11.90 | |
| Profit Margin | 85% |
Why cocktails yield superior profits
- Premium Pricing: Customers pay for craftsmanship
- Ingredient Efficiency: Controlled pours maximize bottle usage
- Perceived Value: Skillful prep supports higher prices
- Upselling: Premium spirits command significant markups
🍷 Wine Service
Typical Margin: 65–80%| Metric | Example | Notes |
|---|---|---|
| Selling Price | $12.00 | 5 oz pour |
| Cost per Pour | $4.17 | From $25 bottle |
| Gross Profit | $7.83 | |
| Profit Margin | 65% |
| Markup | 2.5–3× | Wholesale cost |
| Wholesale Price | $15.00 | |
| Menu Price | $45–$50 | |
| Gross Margin | 65–70% |
Optimization tips
- Focus on wines under $30 wholesale
- Offer wine flights to increase trial
- Train staff on food pairings to boost bottle sales
🍺 Beer
Typical Margin: ~76%| Metric | Example | Notes |
|---|---|---|
| Selling Price | $6.00 | Per pint |
| Cost per Pint | $1.44 | Keg, CO₂, maintenance |
| Gross Profit | $4.56 | |
| Profit Margin | 76% |
| Selling Price | $5.00 | Per bottle |
| Cost per Bottle | $1.20 | |
| Gross Profit | $3.80 | |
| Profit Margin | 76% |
Key considerations
- Draft systems require upfront investment but lower per-ounce cost
- Craft beer commands higher prices but also higher cost than domestic
🥃 Spirits & Neat Pours
Typical Margin: 85–87.5%| Metric | Example | Notes |
|---|---|---|
| Selling Price | $18.00 | 2 oz pour |
| Ingredient Cost | $2.25 | |
| Gross Profit | $15.75 | |
| Profit Margin | 87.5% |
| Selling Price | $8.00 | Standard pour |
| Ingredient Cost | $1.20 | |
| Gross Profit | $6.80 | |
| Profit Margin | 85% |
At a Glance: Margin Comparison
| Category | Typical Margin | Margin Range | Volume Driver | Best For |
|---|---|---|---|---|
| Premium Cocktails | 80–90% | Low–Med | Max profit per drink | |
| Spirits / Neat | 85–87.5% | Low–Med | Minimal prep, high return | |
| Wine by Glass | 65–80% | Medium | Upsell to bottle | |
| Draft Beer | ~76% | High | Revenue through volume | |
| Bottled Beer | ~76% | High | Low overhead, consistent |
Pricing Strategies and Pour Cost Management
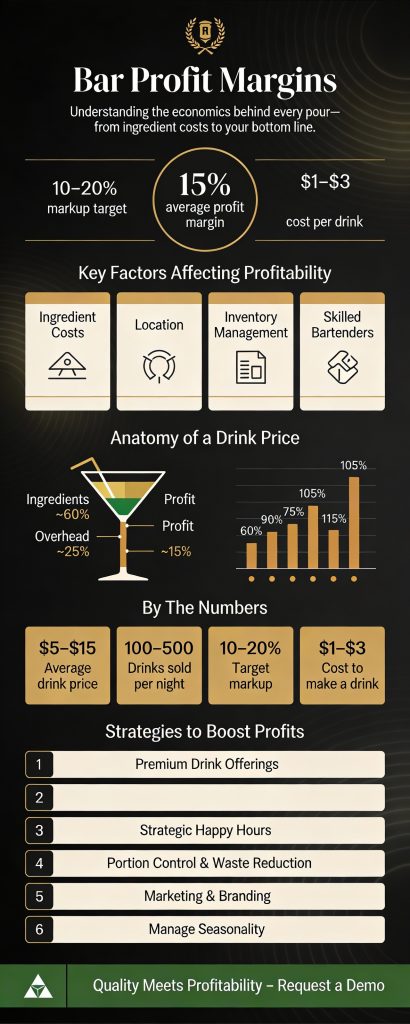
Bars set drink prices based on ingredient costs, overhead, competition, and target profit margins. Typical pour costs range between 10-20%, meaning ingredient costs consume roughly one-fifth of the selling price. This ratio ensures coverage of overhead while generating profit.
Pour Cost Calculation and Pricing Rules
Pour cost percentage is calculated as:
Pour Cost = (Ingredient Cost ÷ Selling Price) × 100
Example: Margarita
- 2 oz tequila: $1.80
- 1 oz triple sec: $0.40
- 1 oz lime juice: $0.30
- Salt rim: $0.05
- Total ingredient cost: $2.55
- Selling price: $12
- Pour cost: 21.25%
Bars often apply the 4-5x markup rule, multiplying ingredient costs by 4 to 5 to derive the selling price, with variations based on spirit quality:
- Well spirits: 4x markup
- Call brands: 4.5x markup
- Premium: 5x markup
- Super-premium: 5.5-6x markup
Pricing also depends on market positioning, customer demographics, and competition. For example, bars in affluent areas can command higher prices, whereas those in price-sensitive markets may rely on volume with tighter margins.
Trusted by The Griffon, British Beer Co, Whole Foods since 2010
The Influence of Location, Happy Hour, and Specials
Location significantly impacts bar profitability. High-traffic, visible locations with affluent clientele support premium pricing and higher margins. Conversely, bars in less desirable areas may need to compete on price and volume. Strategic location selection considers demographics, nearby competition, parking, and ambiance.
Happy hour and specials can boost customer traffic and sales volume but require careful margin management. Properly structured promotions introduce customers to premium offerings while maintaining profitability. Dynamic pricing during events and peak times further optimizes revenue.
Maximizing Profits with Inventory and Staff Management
Inventory management is critical for minimizing waste, theft, and spoilage. Employing point-of-sale systems, regular audits, par levels, and staff training ensures accurate tracking and portion control. These practices help maintain consistent costs and product quality.
Bartenders influence profitability through drink preparation, upselling, and operational efficiency. Training on upselling, recipe standardization, product knowledge, and loss prevention directly supports higher margins.
Marketing, Branding, and Seasonality Effects on Bar Profitability
Effective marketing and branding differentiate bars and attract customers. Strategies include social media marketing, influencer collaborations, themed events, loyalty programs, and local partnerships. These efforts enhance visibility and sales.
Seasonality affects customer traffic and sales, with variations driven by weather, holidays, and tourism. Bars that analyze trends and adjust staffing, inventory, and promotions accordingly can maintain stable profitability year-round.

Frequently Asked Questions About Drink Profits
| Question | Answer |
|---|---|
| What is the average profit margin for a bar per drink? | Gross profit margins vary between 70-85% based on drink type, while net profit margins typically range from 10-15%. |
| How much does it cost a bar to make a typical drink? | Ingredient costs range from approximately $1.20 for well spirits to over $2.50 for premium cocktails. |
| What markup should bars use on drinks? | Aim for a 18-24% pour cost, equating to a 4-5x markup on ingredient costs depending on spirit quality. |
| Which drinks are most profitable? | Premium cocktails achieve the highest margins (80-90%), followed by neat spirits (85-87%), wine by the glass (65-70%), and beer (76%). |
| How is pour cost calculated? | Pour Cost = (Ingredient Cost ÷ Selling Price) × 100. For example, a $12 cocktail with $2.55 in ingredients yields a 21.25% pour cost. |
Bar Profit Margins by Drink Type
About Leah Hill

Leah Hill is the Senior Technical Content & Product Marketing Manager at EvergreenHQ, where she turns complex bar and restaurant tech into clear, practical stories operators can actually use. Drawing on years of experience with POS systems, inventory platforms, and front-of-house tools, she specializes in explaining how technology, automation, and AI can simplify daily service and boost profitability.
At EvergreenHQ, Liana partners closely with the product team to shape new features, test tools in real-world workflows, and create guides that help hospitality teams get value from day one. When she’s not digging into data or drafting playbooks, you’ll usually find her trying new cocktail bars, asking way too many questions about their setup, and turning those insights into her next article